Exploring ESP™

Contents
The ESP™ main window is organized as a series of tabs aligned at the bottom, each tab containing a hierarchical data grid providing an easy and intuitive way to organize and display the data making up your Scenario.
![]()
Clicking on a particular Tab opens the Data Grid for the respective Tab name, displaying data with modifiable column views as well as tool bars that provide quick access to the most common ESP™ features and activities. After opening a Scenario, you continue to work with that Model using one or more of the tabs, their data grids or performing tasks such as applying adjustments, adding or moving Budget Items, adjusting Assumptions and Factors or recalculating the current scope or the entire Scenario.
|
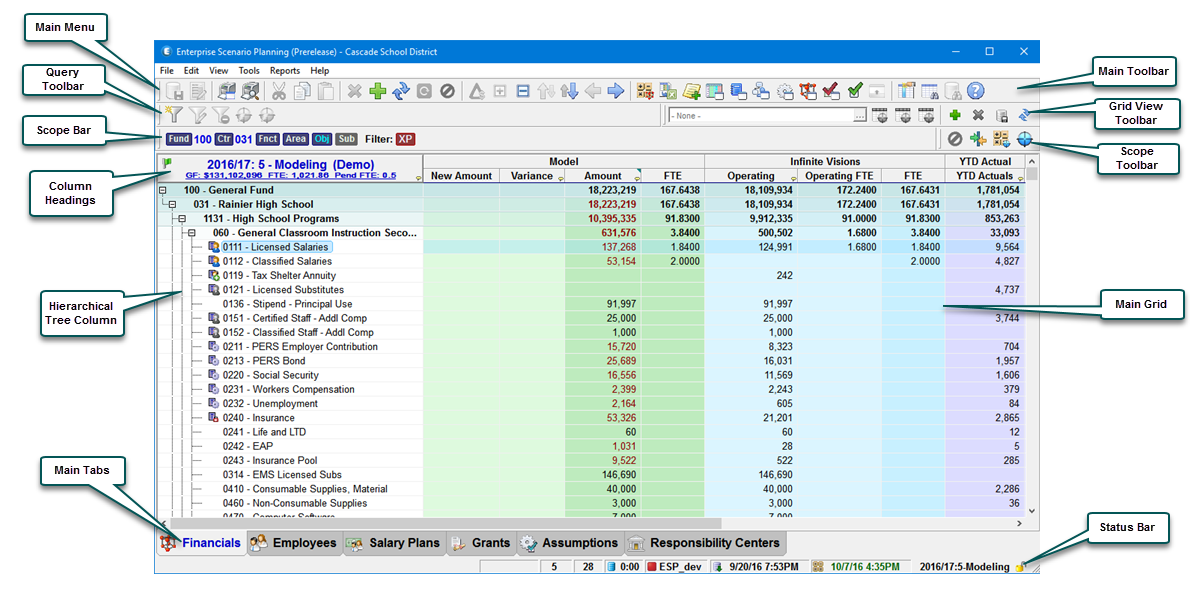
Main Application Tabs
There are several main data grids used in ESP™, each selected from the Main Tabs located on the bottom of the Main window. Each data grid displays specific data based on its context and how it has been set-up. The main tabs include Financials, Employees, Salary Plan, Grants, & Assumptions.
Financials Tab
The Financial tab is the primary place for working with a Scenario's budget data. Budget data is displayed in the hierarchical data grid based on the current Scope selection.
In ESP™, ultimately every activity, either directly or indirectly, affects a Financial Budget Item. Simple Budget Item adjustments can be made which directly change a single value, or more complex adjustments that prorate a given dollar amount over a few hundred Budget Element Strings are possible.

Financials Main Grid
For more information on the Financials grid and instructions for working in the grid, see the Financials topic.
Employees Tab
The Employees tab is the primary place for working with Employee and Position Data. Employee information is displayed in hierarchical data grid based on the current Scope selection.
The information maintained with each Scenario contains a comprehensive view of the employees as loaded from the Human Resources and Payroll systems. As there are multiple factors which impact employee costs, managing them can be a complex process so modeling them is done independent of the Financial budget. As adjustments are made to Scenario assumptions and factors such as Salary Plans, Benefit Plans and Pay Components, employees are then recalculated and rolled-up to the Scenario Financial budget with the Recalculate Scenario process.

Employees Main Grid
See the Employees topic for more information on the Employees grid and instructions for working in it.
Salary Plan Tab
ESP™'s Salary Plans are divided into three components: Plan, Grade and Step. The organization of the Salary Plans is shown on the Salary Plan hierarchical data grid based on that fixed structure. The combination of the Plan, Grade, and Step is referred to as a Salary Plan Code.

Salary Plans Main Grid
For more information on the Salary Plan grid and instructions for working in it, see the Salary Plans topic.
Grants Tab
The Projects grid is used to maintain the administrative fee percentages for Special Revenue Grants or Projects. Many organizations spend a significant portion of their budget on capital projects, and receive large portions of their revenue from grants and endowments. These areas of budget planning can be more challenging in that they typically have a higher level of uncertainty, and often span two or more fiscal years. Sometimes even their mere existence is speculative. The Projects & Grants component provides the elements needed to track and manage these items which have uncertain revenue and expenses and can span multiple fiscal years.

Grants Main Grid
Assumptions Tab
When you consider the concept of budget "Modeling" in ESP™, each and every value whether Financial Budget Items, Employee Fundings, Salary Plans, Benefit Plans, etc., contained within Scenario could be considered an "Assumption" or "Factor". There are however a group of global Assumptions that are applied to one or more areas across the entire Scenario. These global assumptions are shown in the Assumptions tab using a hierarchical data grid and property sheet.
Calculated Assumptions can only be created for Financial Budget Items and have two parts: the Trigger condition that triggers or enables the calculation, and the Calculations themselves. The most common use of Calculated Assumptions is to calculate taxes and fringe benefits for Employees.

Assumptions Main Grid
More information on the Assumption Tree and instructions for working with it can be found in the Assumptions topic.
Responsibility Centers
The Responsibility Center grid allows the monitoring and management of individual Responsibility Centers by both Budget Office staff as well as the Responsibility Managers.

Responsibility Center Main Grid
Scenario Explorer
The Scenario Explorer allows managing Budget Scenarios by displaying them in a hierarchical data grid or "Tree". This Tree shows each Scenario placed relative to the Scenario it was created from, grouped by Fiscal Year.
From the Scenario Explorer, you can perform tasks such as creating new Scenarios, changing the Status, viewing Scenario summary data, or selecting a different Scenario to work with in the main window. Scenario Explorer is accessed by clicking on the Show Scenario Explorer button on the Main Toolbar or from the View ð Scenario Explorer Main Menu.

Scenario Explorer
More information on the Scenario Explorer grid and instructions for working in it can be found in the Scenario Explorer topic.
Main Window Toolbars
Main Toolbar
The Main toolbar is found on all of the main grids and provides one-click access to many of the common tasks that are performed in ESP™. Hovering over any of the buttons will activate a tool tip that indicates the name of the task it initiates. Buttons may be enabled or disabled (gray in color) depending on the action or procedure being performed in the grid.
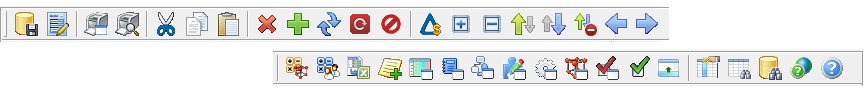
For a complete list of the Main Toolbar button names and their corresponding actions, see the Main Toolbar topic.
Scope Bar
The Scope bar displays the currently selected Scope. It includes the selected elements and ranges, filters and indicators to show which items are "Summed", and which Element is selected in the tree.
![]()
Scope Toolbar
The Scope toolbar, different from the Scope Bar above, appears on the Financial, Employees, Salary Plan and Grants grids. The Open Scope Selection button on the right end opens the Select Scope window for setting the Scope of the current grid.
![]()
More information about Scenario Scope, Selection and Filters can be found in the Scenario Scope topic.
Query Toolbar
The Query toolbar allows users to create and save dynamic filters on ESP™ data. By using standard Boolean operators such as AND, OR, and NOT, you can create customized search conditions to get more accurate results. Hovering over any of the buttons will activate a tool tip that indicates the name of the the task it initiates.
![]()
Refer to the Query Toolbar topic for a diagram and description of the Search Query buttons and functionality.
Saved View Toolbar
The Saved View toolbar allows users to save column layout and Scope to named views that can be easily restored with a selection from the list. Saved Views can be saved as public Grid Views so other users can take advantage of them.
![]()
Refer to the Saved Grid View Toolbar topic for a diagram and description of the Search Query buttons and functionality.
Scenario Scope
Scope is a signature feature of ESP™: a powerful tool that allows you to select a subset, or portion, or the Scenario you want to work with. The subset of Budget Element Strings selected in a Scenario is referred to as the Scenario Scope or just Scope. From a system performance perspective, the smaller the Scope, the more responsive the system will be.
Clicking on the Open Scope Selection button from the Financials or Employees grid opens a dialog window where you will set the Scenario Scope that you want to work in.
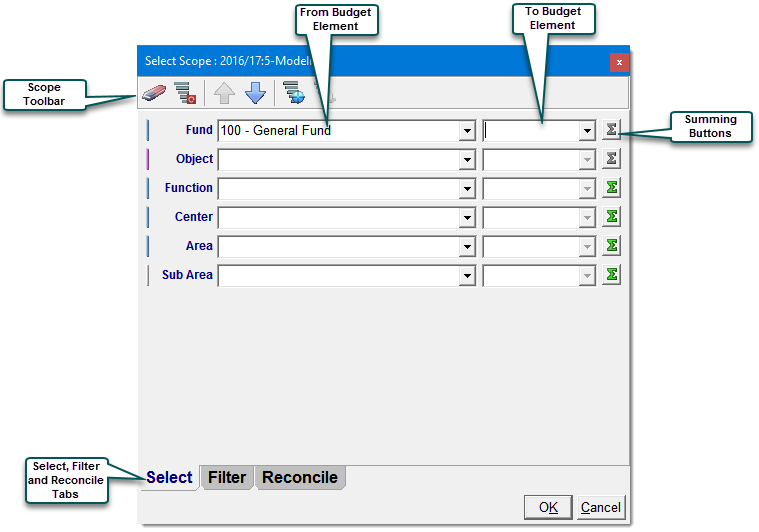
In Scope Select dialog, drop-down boxes are provided for selecting the element you want to work with. Optionally, you can enter element lists, ranges, or a combination of both, to narrow your chosen Scope. The Summing and Filtering features offer additional choices for specifying how you want to display the Scenario information.
See the Scenario Scope topic for more detailed information on Selecting and Filtering Scope.